Market Perspectives April 2021
Capital Markets
By: Wade Austin
March marked the one year anniversary of when the government’s top infectious disease expert recommended a 14 day national shutdown to slow the spread of the coronavirus. While the virus is still dangerous and various restrictions remain, the contrast in climate for financial markets couldn’t be starker. Sentiment driving markets have flipped from worrying about an abrupt recession and even of depression whispers to reopen optimism and inflation fears.
Last year, the 10-year U.S. Treasury yield began Q1 at 1.9% before collapsing to an all-time low of 0.4% by March 9, 2020. This year, accelerating vaccine doses, new fiscal stimulus, and the Fed reconfirming its dovish monetary policy are positive drivers for robust economic growth. However, these same catalysts also formed headwinds for fixed income returns.
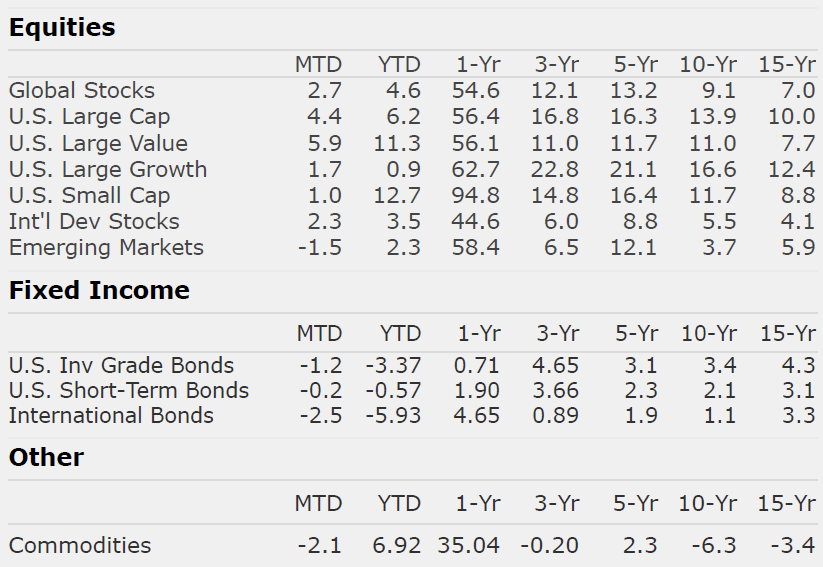
Upward pressure on yields and inflation fears sparked a bond market selloff in Q1. Beginning this year at 0.93%, the 10-year U.S. Treasury yield spiked 81 bps to close March at 1.74%. The U.S. Aggregate Bond Index’s quarterly return (-3.37%) was its worst on record. International (-5.93%) and EM (-3.48%) aggregate bond market indexes fared worse. Senior loans (+2.01%) and high yield corporates (+0.86%) were the only taxable fixed income categories to generate gains.
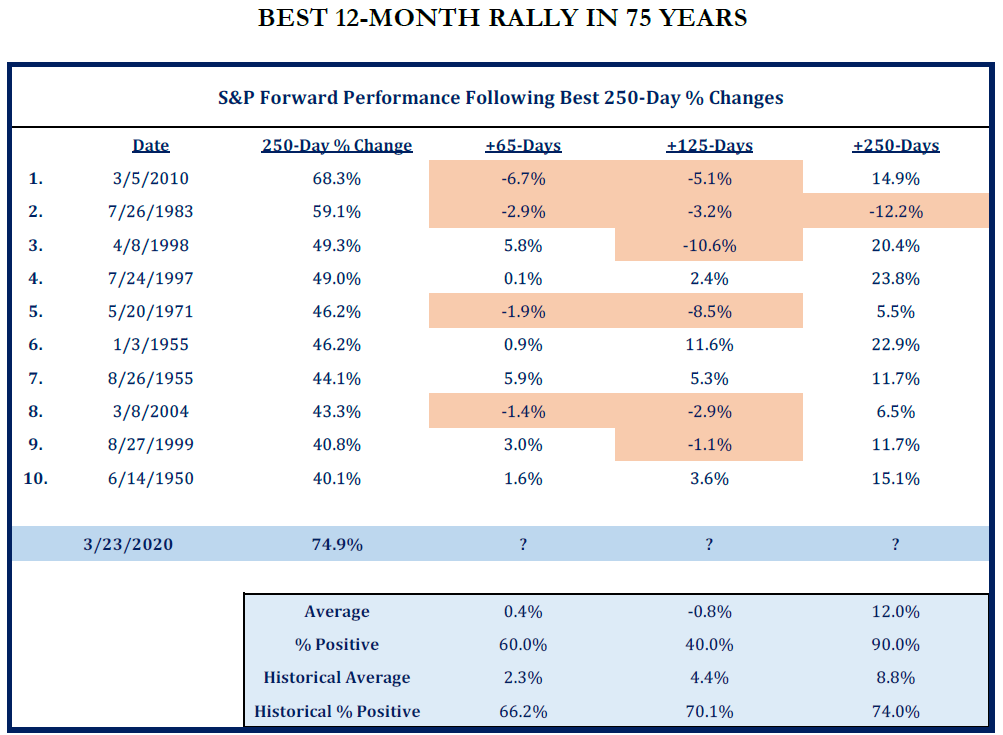
The year-over-year dissimilitude in equity markets has been just as extreme. The S&P 500’s historic four-week rout (-34%) bottomed on March 23, 2020. This March, the U.S. benchmark equity index concluded its fourth consecutive positive quarter and posted its best 12-month rally in 75 years (see our Chart of the Month). The DJIA crested 33,000, and the S&P 500 has just reached 4,000.
Underneath the surface of the S&P 500’s handsome 6.2% return in Q1 2021, value stocks (+11.3%) crushed growth (+0.9%), while small-caps (+12.7%) doubled large. The shift toward those cyclical sectors viewed as the biggest beneficiaries from re-openings propelled the returns of energy (+30.9%), financials (+16.0%), and industrials (+11.4%). The selloff of high P/E, growth stocks that began in mid-February continued into March before rebounding slightly the last week of the quarter.
International (+3.5%) and EM (+2.3%) stocks posted positive returns in Q1, although they retreated from their early March highs due to inconsistent vaccine rollouts and new Covid variants that impacted some countries worse than others.
Entering Q2 and Year 2 following the bear market low, S&P 500 breadth (% of stocks above their 200-day moving average) was at its highest levels since 2009. As noted last month, such broad participation is not indicative of a market top. More economic good news is still ahead of us including additional fiscal stimulus, herd immunity, re-openings, and pent-up demand for services among U.S. consumers with savings accounts at historically high levels.
Key risks are emerging, yet the critical dynamic continues to be the virus and the vaccine. We will also be mindful of the potential for shocks to global supply chains, fiscal resource misallocation (e.g., components inside the infrastructure package), tax policy mistakes, rising inflation that forces the Fed to tighten, and geopolitical flare ups.
As the vast divide between reality and expectation typically begins to close during Year 2 of recoveries, our Chart of the Month reveals that markets can become more of a grind but also warrants a pro-risk outlook for long-term investors.
Insights by John Silvia, Director of Economics

Last week’s jobs report provided further evidence for the positive outlook for the economy based upon a reading of leading economic indicators such as jobless claims, factory orders/shipments, building permits and consumer sentiment. Job gains were present across the major employment categories with a very large gain in the leisure and hospitality sector as many states open even more.
For all of 2021, economic growth is expected to be 4% plus which is above the long-term growth trajectory. Therefore, inflation is expected to continue to rise in the year ahead. This will present some challenges to investors.
- Until recently, the inflation trajectory as well as inflation expectations were downward. This trajectory kept the Fed on hold and interest rates low. However, with inflation rising, interest rates have tended to follow. At the start of this year, the ten-year benchmark U. S. Treasury rate was 0.93% and the rate was 1.74% last Friday.
- Rising inflation and benchmark interest rates command a review of your investment strategy with respect to holdings of cash and U.S. treasury debt in your portfolio.
- Investment opportunities change as the economic recovery evolves often due to changes in inflation, interest rates and the value of the dollar.
- In addition, a new political administration has introduced new priorities with respect to taxes, energy development and infrastructure. All of these require further details from the administration and may require further review of your portfolio.
Clients have been rewarded by following the fundamentals and taking a longer view of their position. Recessions are part of the economic cycle, but recovery and expansion are longer lasting. This has not changed.
Clients are also rewarded by recognizing that the economy evolves and political priorities change. Our investment priorities will change as well.
Quote of the Month
“The desire to perform all the time is usually a barrier to performing over time.”
Robert Olstein – Chairman, The Olstein Funds
Chart of the Month
The information published herein is provided for informational purposes only, and does not constitute an offer, solicitation or recommendation to sell or an offer to buy securities, investment products or investment advisory services. All information, views, opinions and estimates are subject to change or correction without notice. Nothing contained herein constitutes financial, legal, tax, or other advice. The appropriateness of an investment or strategy will depend on an investor’s circumstances and objectives. These opinions may not fit to your financial status, risk and return preferences. Investment recommendations may change, and readers are urged to check with their investment advisors before making any investment decisions. Information provided is based on public information, by sources believed to be reliable but we cannot attest to its accuracy. Estimates of future performance are based on assumptions that may not be realized. Past performance is not necessarily indicative of future returns. The following indexes were used as proxies in the performance tables: Global Stocks = MSCI ACWI; U.S. Large Cap = S&P 500; U.S. Large Value = Russell 1000 Value; U.S. Large Growth = Russell 1000 Growth; U.S. Small Cap = Russell 2000; Int’l Dev Stocks = MSCI EAFE; Emerging Markets = MSCI EM; U.S. Inv Grade Bonds = Barclays U.S. Aggregate; U.S. High Yield Bonds = Barclays Corporate High Yield; Emerging Markets Debt = JPMorgan EMBI Global Diversified; Int’l Bonds = Barclays Global Treasury ex US; Cash = 3month T-Bill; Sector returns displayed in the chart represent S&P 500 sectors, while treasury benchmarks are from Barclays
Sources: Strategas
Chart of the Month
Quote of the Month
“The desire to perform all the time is usually a barrier to performing over time.”
Robert Olstein – Chairman, The Olstein Funds
Trailing Returns