Market Perspectives December 2020
Capital Markets
By: Wade Austin
Equity markets worldwide experienced a “melt up” in November. The Dow Jones Industrial Average breeched the 30,000 milestone and rose 12%, marking its best month since January 1987. The broader S&P 500’s 10.9% return was its highest November tally since 1950 and the fifth best of any month since January 1985.
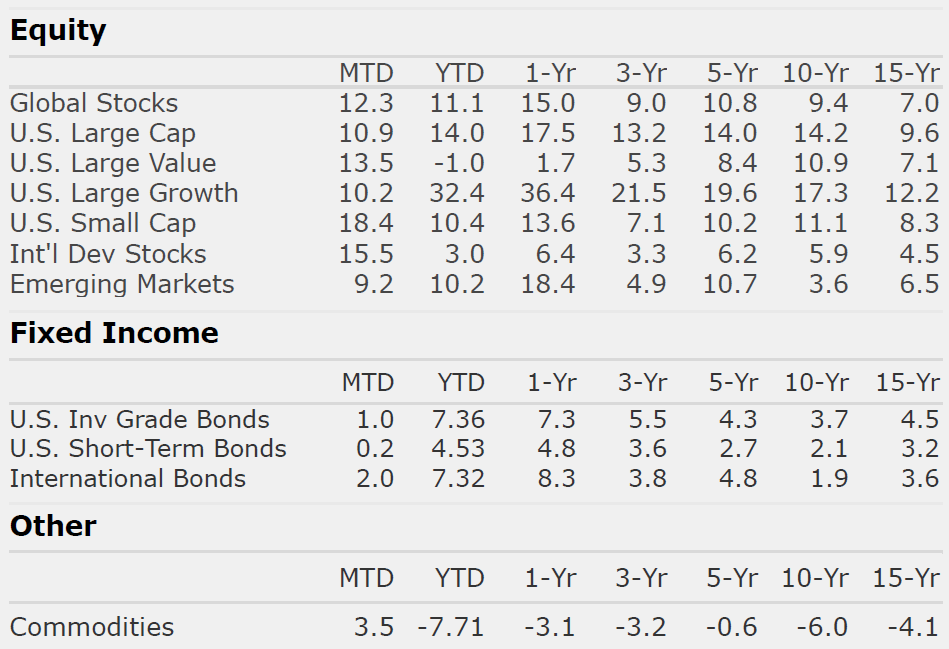
The rally’s breadth has been most impressive with 93% of the S&P 500 constituents priced above their 200-day moving average – a bullish signal. While the NASDAQ 100 took a breather after its September 2nd high, small-cap stocks have outperformed large-caps, surging a whopping 18.4% in November alone.
The gains weren’t limited to just U.S. corporations. The global top performer was International stocks, up a stellar 15.5%, while the laggard Emerging Market stocks only gained 9.2%. The U.S. dollar weakened post-election which has the effect of amplifying overseas returns.
The catalysts were easing worries over the U.S. election and the pandemic. Leading up to the election, we advised that Wall Street had already priced in certain election scenario anxieties. Markets appear comfortable with the results – more moderate policies and the checks and balances typically associated with a narrowly divided government.
As the pandemic induced humanitarian crisis continues, the light at the end of the tunnel shone brighter after news of likely FDA approval in December of three promising vaccines developed by Pfizer, AstraZeneca, and Moderna. Investor optimism was reflected not only in the stock market. Vaccine developments triggered a positive market risk sentiment in fixed income sectors as well. The yield on the 10-Year U.S. Treasury note held steady despite the distressingly large surge in new cases, while the monthly total returns of High Yield, EM debt, and Municipal bonds all exceeded 2.5%.
In closing out a tumultuous year and eagerly looking forward to 2021, we ask, “What could go wrong from here?“ Topping the list of potential triggers for a near-term pullback are:
- Lockdown 2.0 risks
- Disrupted vaccine deployments
- Failure to pass a 2nd fiscal stimulus package resulting in permanent economic scarring
- A Democratic sweep of the Georgia Senate runoff elections enabling the passage of major tax increases in 2021.
With these risks, additive to seemingly overbought conditions, equity markets are vulnerable to additional volatility. Yet, we will also consider what can go right. Considerations for a pro-risk stance include:
- A successful vaccine rollout that ignites a robust global economic recovery
- Pent-up demand and organic growth creating favorable 2021 YOY earnings’ comps
- A continued low inflation and low interest rate environment more favorable to equities than bonds
- Plenty of dry powder still on the sidelines are compelling.
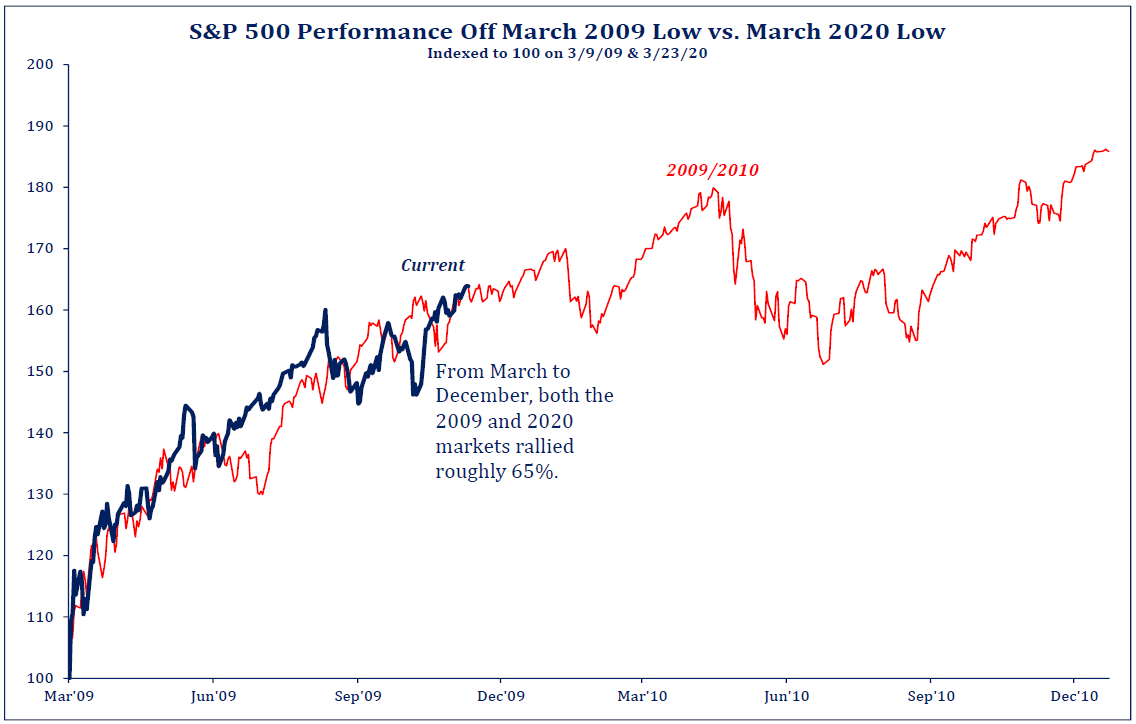
The prudent positioning for most, as veteran CIC economist John Silvia encourages us, is to “take the long view.” Of all the dramatic twists and turns during 2020, our Chart of the Month reveals maybe the market’s biggest surprise of all: the remarkable symmetry with the prior crisis’ recovery. Perhaps the 2009/2010 path sketches out an outline of the risks AND rewards that lie ahead.
Insights by John Silvia, Director of Economics

Last week’s employment and manufacturing data highlight the continued growth of the economy but at a more subdued pace after the initial recovery from the COVID shutdowns. Job growth has slowed yet the unemployment rate continued to decline. Manufacturing surveys evidence a decline but remain above breakeven in production and orders. Housing remains solid with gains in single housing starts and building permits.
For investors, the case for positive economic growth remains in place. Meanwhile, the outlook for monetary policy remains for continued low interest rates for the next year or two. Inflation, as measured by the consumer price index, is at 1.6% over a year ago. Therefore, it is not surprising that 10-year and 2-year Treasury rates are likely to remain low (below 2 and 1 percent, respectively).
Three factors support the case for growth going forward. First, the outlook for 2021 is for stronger global growth especially for Asia. Second, a possible vaccine will begin use in a few months and strengthens the case for the economy and equity markets. Finally, a new, modest stimulus program appears likely within the next two months.
The consumer engine, the largest component of the economy is supported by the gains in jobs and income gains. In addition, household wealth remains at an all-time high in the latest quarter as equity values and home prices continue to rise.
Each recession/recovery presents structural challenges to certain segments of the economy such as hotels and retail/office real estate. Even here, however, recent prices have attracted long-term investors who anticipate a turnaround in communities with favorable demographic/job trends.
Clients have been rewarded by following the fundamentals and taking a longer view of their positions. Recessions are part of the economic cycle, but recovery and expansion are longer lasting, and for each expansion, the economy moves ahead to a higher standard of living.
On the cautious side, there is the public debt issue which we follow as the reality of declining potential growth estimates and a rising deficit to GDP estimate by the Congressional Budget Office will force some hard choices going forward.
Quote of the Month
“The best investment with the least risk and the greatest dividend is giving.”
Sir John Templeton – Legendary Investor and Philanthropist
Chart of the Month
The information published herein is provided for informational purposes only, and does not constitute an offer, solicitation or recommendation to sell or an offer to buy securities, investment products or investment advisory services. All information, views, opinions and estimates are subject to change or correction without notice. Nothing contained herein constitutes financial, legal, tax, or other advice. The appropriateness of an investment or strategy will depend on an investor’s circumstances and objectives. These opinions may not fit to your financial status, risk and return preferences. Investment recommendations may change, and readers are urged to check with their investment advisors before making any investment decisions. Information provided is based on public information, by sources believed to be reliable but we cannot attest to its accuracy. Estimates of future performance are based on assumptions that may not be realized. Past performance is not necessarily indicative of future returns. The following indexes were used as proxies in the performance tables: Global Stocks = MSCI ACWI; U.S. Large Cap = S&P 500; U.S. Large Value = Russell 1000 Value; U.S. Large Growth = Russell 1000 Growth; U.S. Small Cap = Russell 2000; Int’l Dev Stocks = MSCI EAFE; Emerging Markets = MSCI EM; U.S. Inv Grade Bonds = Barclays U.S. Aggregate; U.S. High Yield Bonds = Barclays Corporate High Yield; Emerging Markets Debt = JPMorgan EMBI Global Diversified; Int’l Bonds = Barclays Global Treasury ex US; Cash = 3month T-Bill; Sector returns displayed in the chart represent S&P 500 sectors, while treasury benchmarks are from Barclays
Sources: Strategas
Chart of the Month
Quote of the Month
“The best investment with the least risk and the greatest dividend is giving.”
Sir John Templeton – Legendary Investor and Philanthropist
Trailing Returns