Market Perspectives November 2021
Capital Markets
By: Wade Austin
What a difference a month can make! Investor sentiment experienced a V-shaped recovery in October after turning cautious – if not fearful – in September. Equity markets rebounded sharply as the S&P 500’s 7.0% gain in October erased September’s 4.7% decline.
In last month’s Market Perspectives, we acknowledged many headline risks but stressed the importance of remaining focused on fundamentals. Right on cue, the turnaround’s primary catalyst proved to be another surprisingly strong quarterly earnings season. With 90% of the S&P 500 having reported Q3 results, corporations grew earnings 41.5% and revenue 16.2%. Q3 marks the sixth consecutive quarter that corporate earnings growth has exceeded analysts’ initial estimates by at least 10%. Surging Delta variant cases during Q3 dramatically impacted GDP growth (only 2.0%), but recent subsiding trendlines and promising new antiviral medications have also contributed to Q4’s sudden optimism. GDP forecast for Q4 are now as high as 8.2% growth.
Beginning mid-October, the S&P 500 rallied to its best month since November 2020 and recorded this year’s 59th all-time high on October 29th. All eleven equity sectors logged gains on a total return basis. Consumer Discretionary (+10.9%) was the month’s leading sector, propelled by Tesla’s 43.7% pop. Energy (+57.9%) continues to lead all sectors YTD despite potentially disruptive, longer-term climate change initiatives. International developed market stocks also posted a solid monthly gain (+2.5%), while continued heavy losses in China saddled the broad-based emerging market index (+1.0%).
U.S. Treasury yields inched higher during October amid elevated inflationary pressures and in anticipation of the Federal Reserve announcing a timeline for tapering asset purchases. As a result, the Barclays U.S. aggregate bond index declined modestly for the month and remained negative YTD (-1.6%). TIPS (inflation-indexed securities) led all fixed income sectors, rallying 1.1% and benefiting from elevated inflation expectations.
Last week, the Fed announced their well-telegraphed taper, but the more impactful development was on the fiscal front. Equity markets surged after President Biden unexpectedly removed capital gains and corporate tax rate hikes from his spending and tax bill. Analysts immediately raised their 2022 corporate earnings forecasts, although increasing labor and input costs, if persistent, will pressure operating margins.
The S&P 500’s 24% gain through October marked the ninth time it has achieved a +20% October YTD return in the past 70 years. During the previous eight occasions, the ensuing November/December period always finished higher with an average gain of 6.2%.
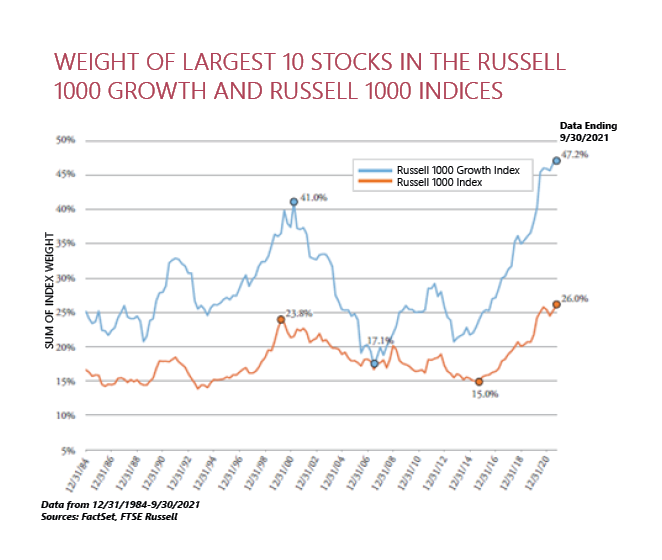
While large-cap U.S. stocks have outperformed both YTD and over the past three years, it’s the mega-cap stocks that have dominated. The index weighting of the current ten largest growth stocks has surpassed index concentration levels last reached 21 years ago (see our Chart of the Month). Notably, five of those ten largest stocks from the dot-com era are still trading below their March 2000 price.
Today’s tech giants (Microsoft, Apple, Alphabet, Amazon, Tesla, Facebook, and NVIDIA) have compelling and profitable business franchises yet lofty valuations. Looking forward, we aren’t suggesting a 20-year price decline like Lucent, Citigroup, GE, AT&T, or Cisco Systems. However, in a shifting economic environment (i.e., reopening tailwinds, Fed tapering, elevated inflation, and potential rate hikes), small-cap, large-cap cyclical, and international strategies present attractive opportunities, too. We continue to believe a disciplined and diversified investment approach offers the best path to preserving wealth and achieving your long-term financial goals.
Insights by John Silvia, Director of Economics

- This week’s consumer price inflation numbers highlight that inflation has become the number one issue for policy makers and investors. October consumer prices (CPI) rose 6.2% over the last year – the fastest 12-month pace since 1990. While we may be seeing peak inflation numbers right now, October’s sizeable increase suggests inflation concerns cannot be dismissed.
- Meanwhile, employment gains are solid – signifying good economic growth. There were broad based gains across many sectors of the economy, and the unemployment rate fell again. We may be approaching full employment in the first half of next year.
- Structural issues are manifest in the drop in both the labor force and the employment-population ratio compared to Feb. 2020. Therefore, it is not surprising that firms are complaining about the lack of skilled labor. The demand side of the labor market is strong; however, the supply side is lacking.
- Comprehending both inflation and growth data, the Federal Reserve announced the start of a reduction in their pace of asset purchases with the completion of the taper by mid-2022.
- For all of 2021, economic growth is expected to be 6% with strong gains in consumer spending, residential investment, and business investment. Inflation rates have risen over the past year and will present several challenges to investors as real returns on cash and sovereign debt continue negative. With the Federal Reserve now committed to reducing their expansionary policy, the stage is now set for additional volatility in financial asset prices.
- Benchmark Treasury yields began rising in August along with inflation concerns. Persistent inflation remains an issue for Treasury debt owners and buyers.
- As consistent with Fed policy intentions, our expectation is that inflation and benchmark interest rates will rise, along with a steady decline in the U.S. dollar value. The longer-run view is for higher inflation and interest rates. Therefore, after inflation and taxes, real returns are often negative.
- Even within an economic expansion, there are periods of accelerating and decelerating growth/inflation benchmarks that can distract from the long-run goals of investors. Investment opportunities and risks change as the economic recovery evolves, often due to changes in economic policy.
Quote of the Month
“What the wise man does in the beginning, the fool does in the end.”
Old Proverb
Chart of the Month
The information published herein is provided for informational purposes only, and does not constitute an offer, solicitation or recommendation to sell or an offer to buy securities, investment products or investment advisory services. All information, views, opinions and estimates are subject to change or correction without notice. Nothing contained herein constitutes financial, legal, tax, or other advice. The appropriateness of an investment or strategy will depend on an investor’s circumstances and objectives. These opinions may not fit to your financial status, risk and return preferences. Investment recommendations may change, and readers are urged to check with their investment advisors before making any investment decisions. Information provided is based on public information, by sources believed to be reliable but we cannot attest to its accuracy. Estimates of future performance are based on assumptions that may not be realized. Past performance is not necessarily indicative of future returns. The following indexes were used as proxies in the performance tables: Global Stocks = MSCI ACWI; U.S. Large Cap = S&P 500; U.S. Large Value = Russell 1000 Value; U.S. Large Growth = Russell 1000 Growth; U.S. Small Cap = Russell 2000; Int’l Dev Stocks = MSCI EAFE; Emerging Markets = MSCI EM; U.S. Inv Grade Bonds = Barclays U.S. Aggregate; U.S. High Yield Bonds = Barclays Corporate High Yield; Emerging Markets Debt = JPMorgan EMBI Global Diversified; Int’l Bonds = Barclays Global Treasury ex US; Cash = 3month T-Bill; Sector returns displayed in the chart represent S&P 500 sectors, while treasury benchmarks are from Barclays
Chart of the Month Source: Strategas, YTD as of 10/4/2021.
Chart of the Month
Quote of the Month
“What the wise man does in the beginning, the fool does in the end.”
Old Proverb
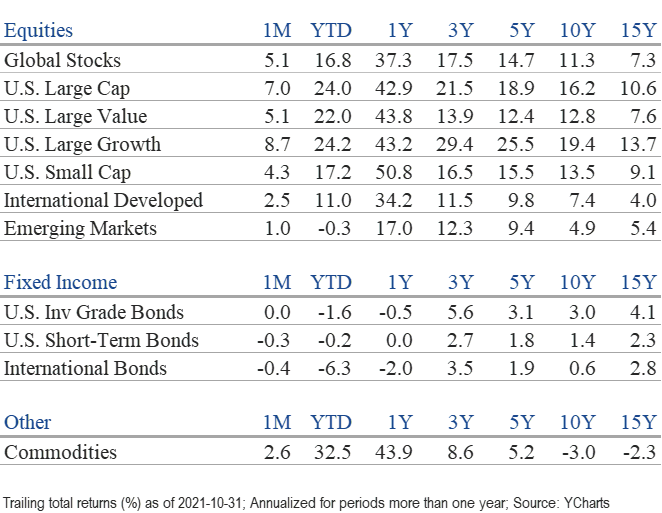
Trailing Returns